Creating Friendly Course Schedules Using Google Docs and Google DataStudio for Use on Departmental Website
This is an intermediate topic. You will need to possess some basic understanding and have some experience with Drupal content editing.
Required Tools
- Central Google Account - If you do not have a departmental google account, it would be a good to set one up. We recommend that you NOT use your personal google account. Create Google Account Now
- Google Sheets - tool for organizing and storing course schedule data (https://docs.google.com/spreadsheets/)
- Google Data Studio - reporting tool that we will use to generate nice table styles (with auto-sorting clickable columns)
Students often need to reference a schedule of courses for each semester. Currently the only way to see an up to date course schedule is for students to download the single PDF schedule file for all UGA courses and search for the course acronyms. The file is very large and difficult to use on a mobile device.
This documentation will walk you through the steps of creating a filterable spreadsheet of courses that you can link up to your departmental web site.
Example of a Filterable Spreadsheet: Demo Course Schedule Link
Please Note: We are no longer using Awesome Table for styling the course schedules, as they started charging per page view. We are now using Google Data Studio to style the schedules.
Step-by-Step Guide
This document will be broken down into three sections:
- Creating Course Schedule Spreadsheets
- Creating the Report in Google Data Studio
- Creating a Basic Page in Your Drupal Site and Embedding the Report
Section 1: Creating Course Schedule Spreadsheets
Step 1: Create Google Spreadsheet
Using your central google account, create a google spreadsheet which will contain the data for your course schedule for the upcoming semester. Label the spreadsheet by the semester and year.
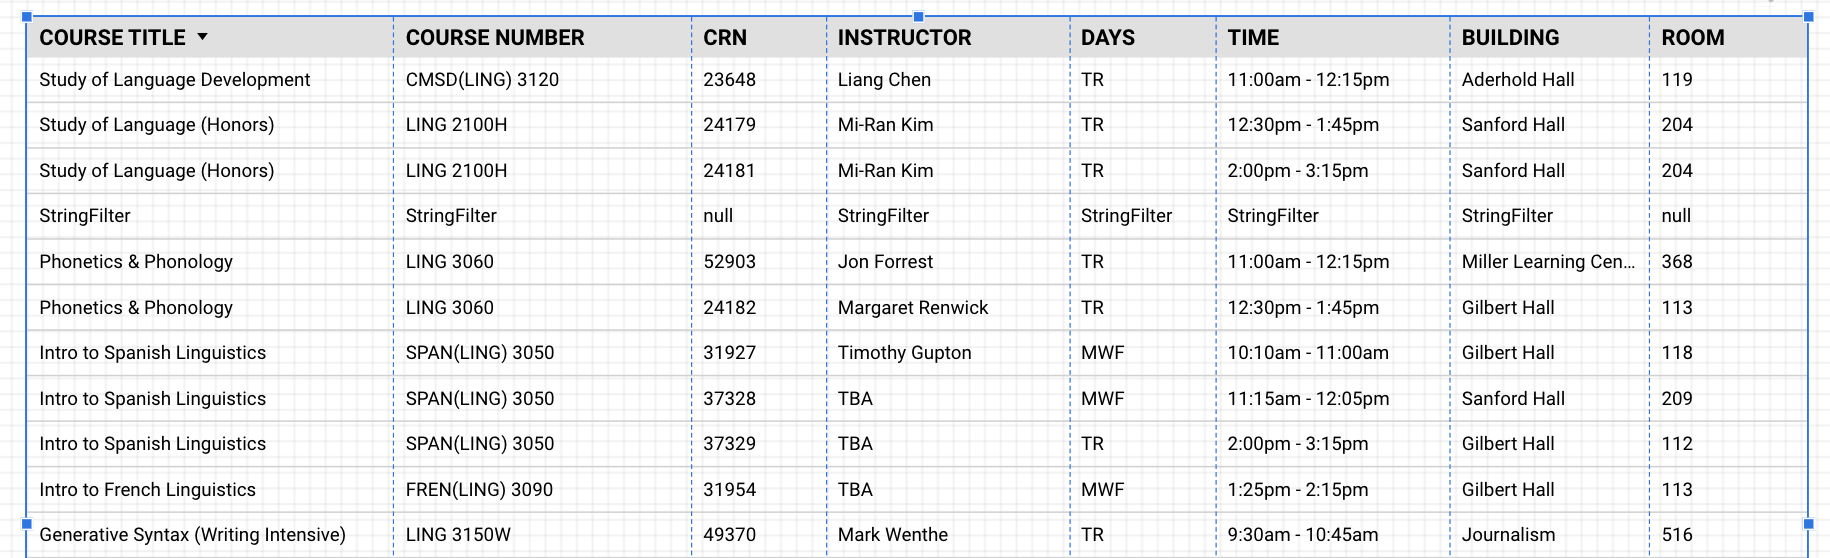
We recommend a format like this:
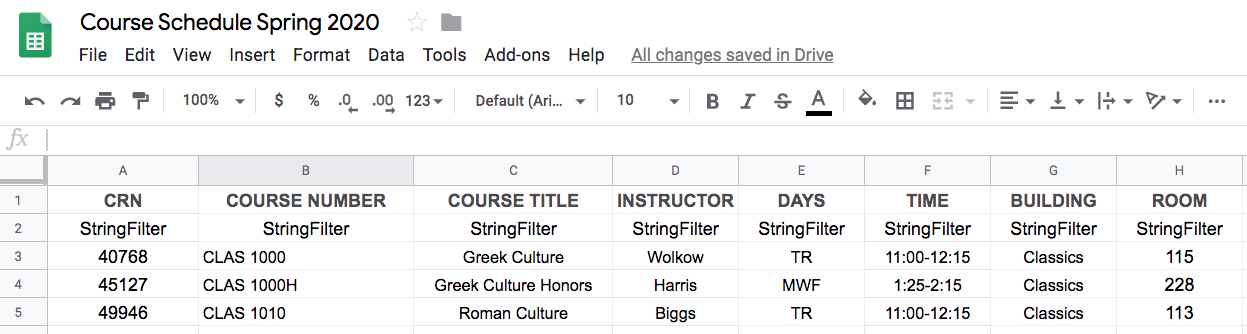
The first row represents the field names and the 2nd row is needed to identify which fields will be filterable in the final product. Any field which has "StringFilter" below it, will be filterable.
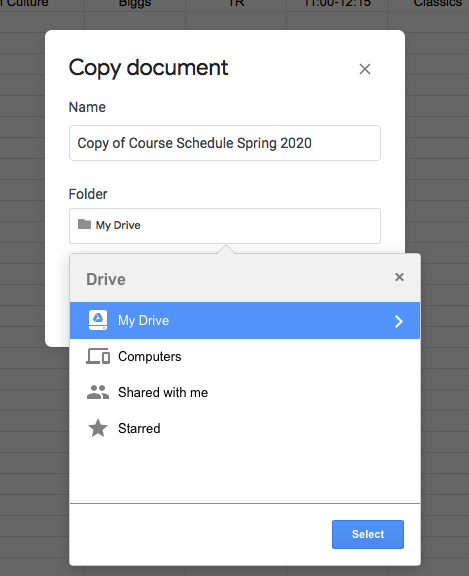
Here is a link to this example file if you want to duplicate it for your use. To copy it, click the link below, then choose from the menu "file > create a copy" and choose where you want to put the file in your google drive.
https://docs.google.com/spreadsheets/d/1uWuBFN13l3e8r6NggecA8EjGmUkaaw-03G60dSX3a6U/edit?usp=sharing
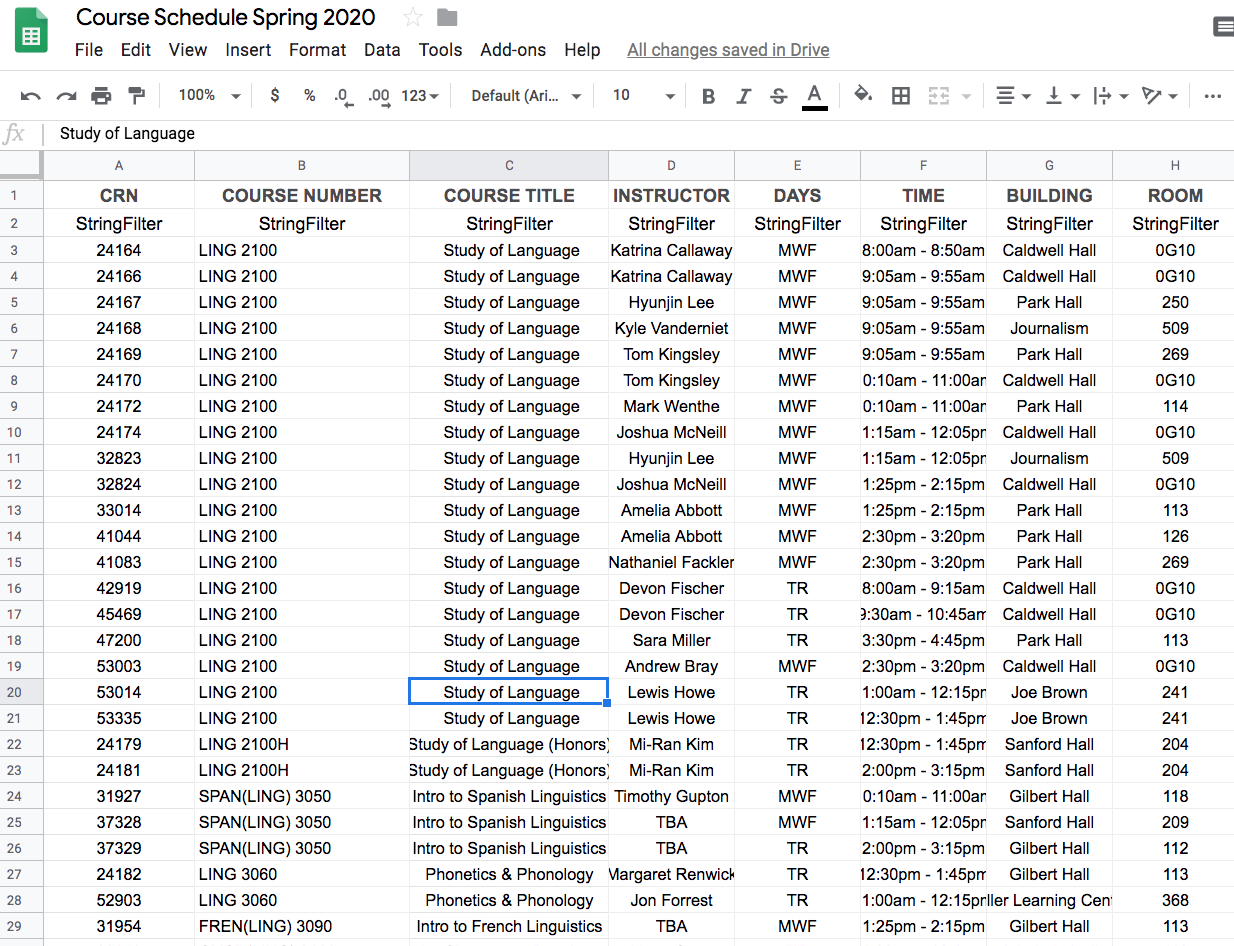
Step 2: Populate Your Course Data
Enter all the relevant data for each course into this spreadsheet.
Section 2: Creating the Report in Google Data Studio
Step 1: Connect the Spreadsheet to Google Data Studio
Go to datastudio.google.com.
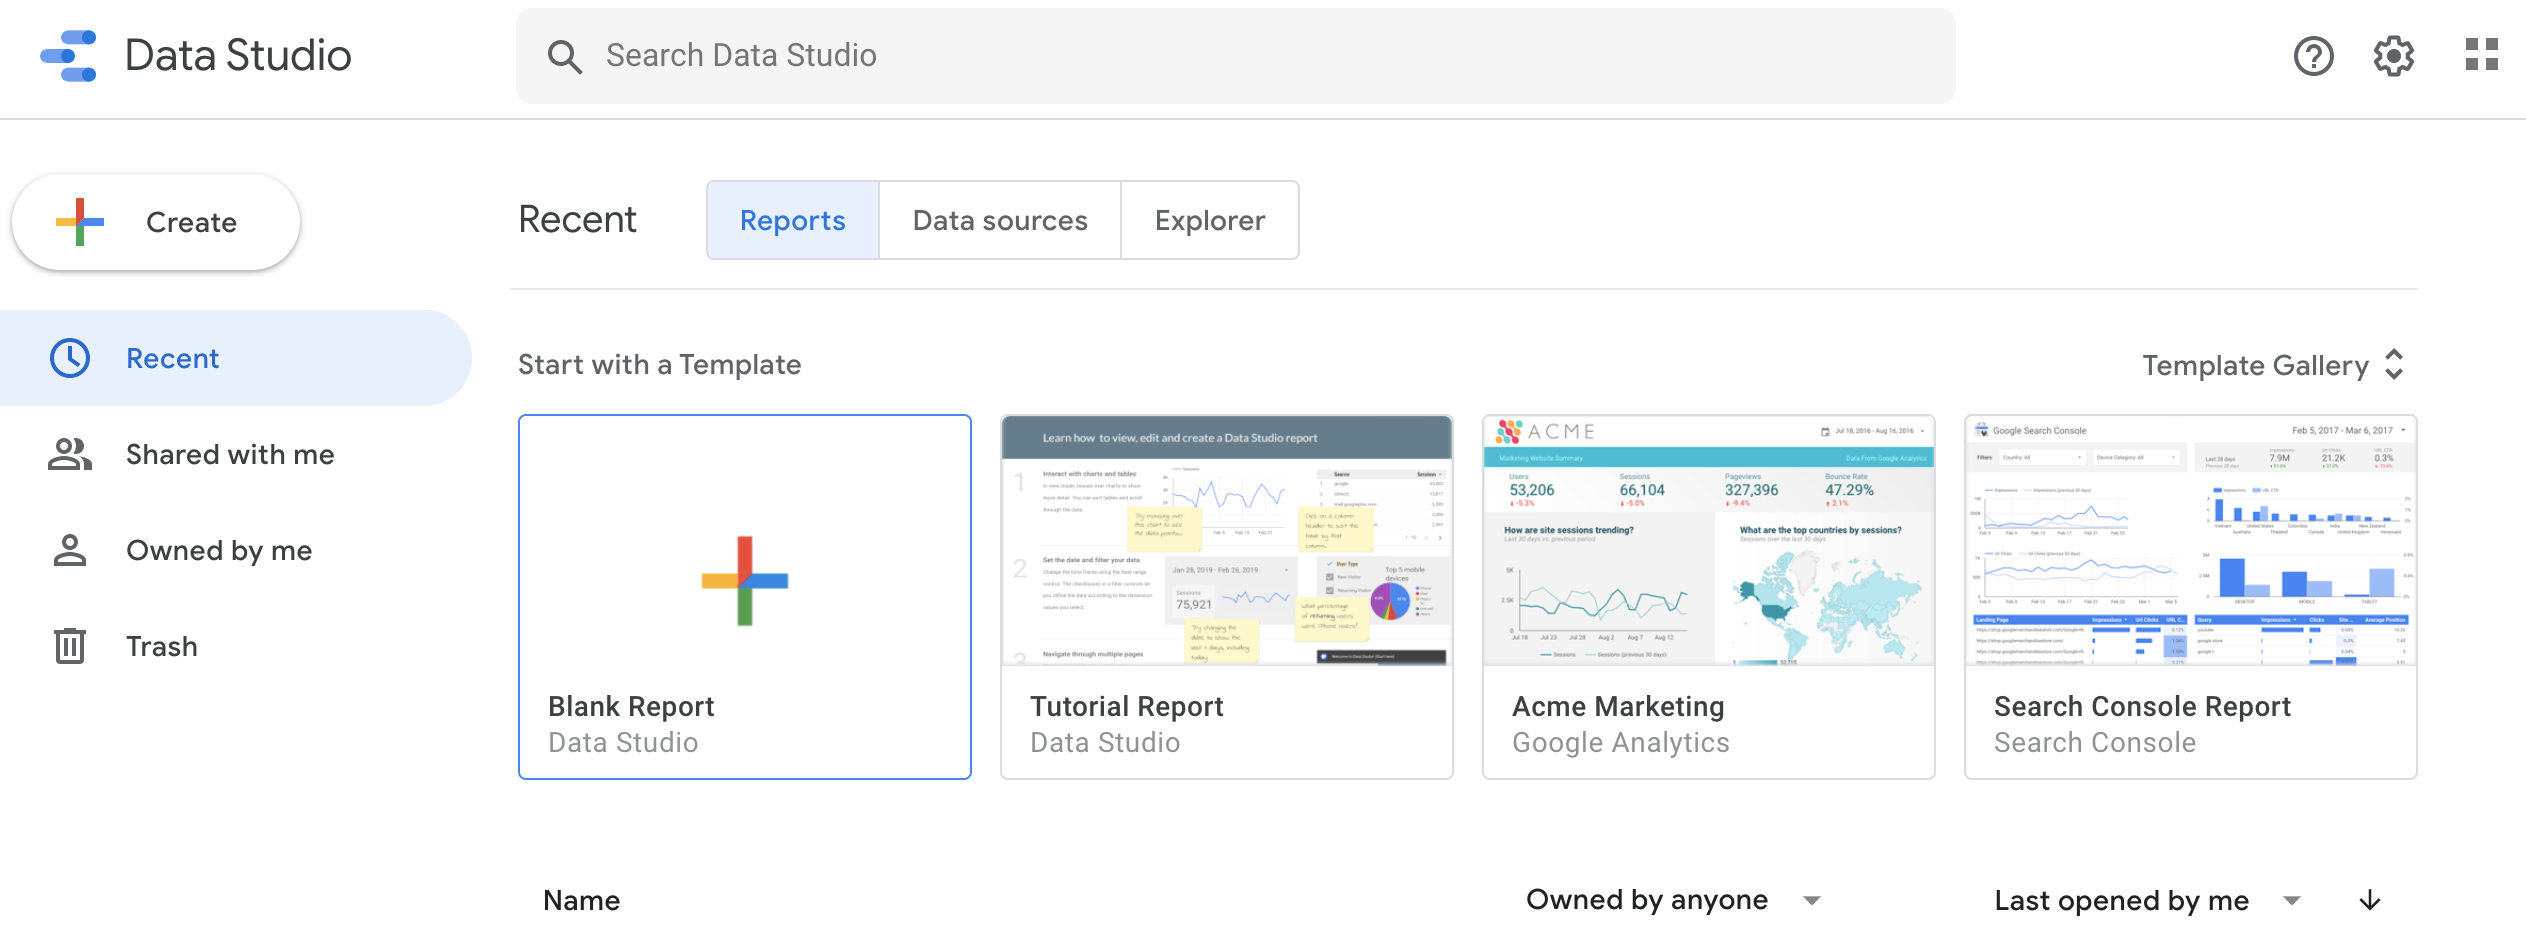
Select a blank report.
![]()
It will then ask you to add data to the report via various types of data connections.

You want to connect it to Google Sheets.
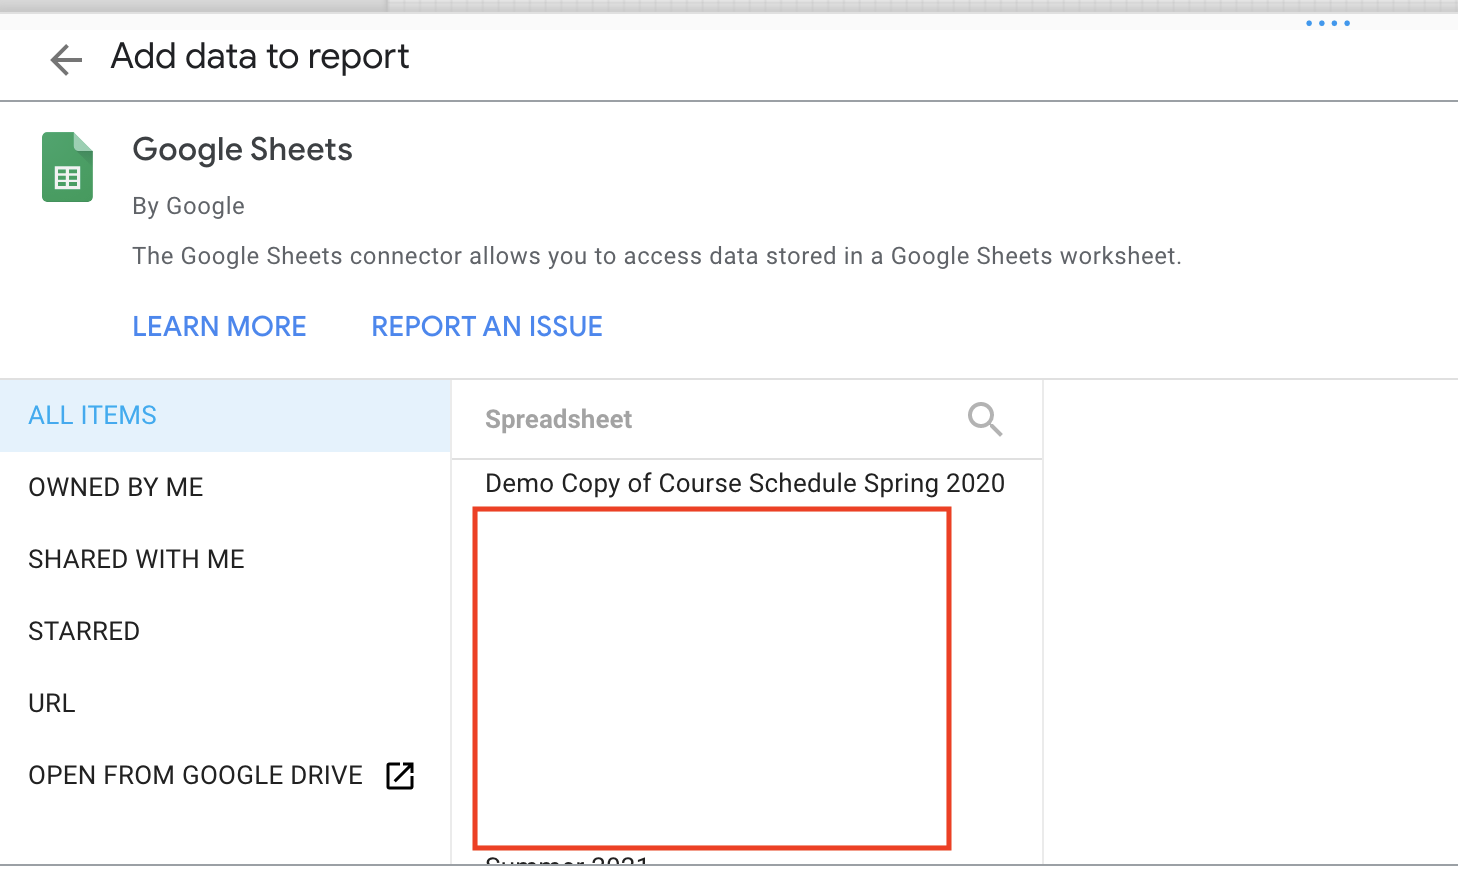
Google will then walk you through the process of connecting to the correct Worksheet, then the correct Sheet within the worksheet (which will presumably be the default sheet, unless you've added more).

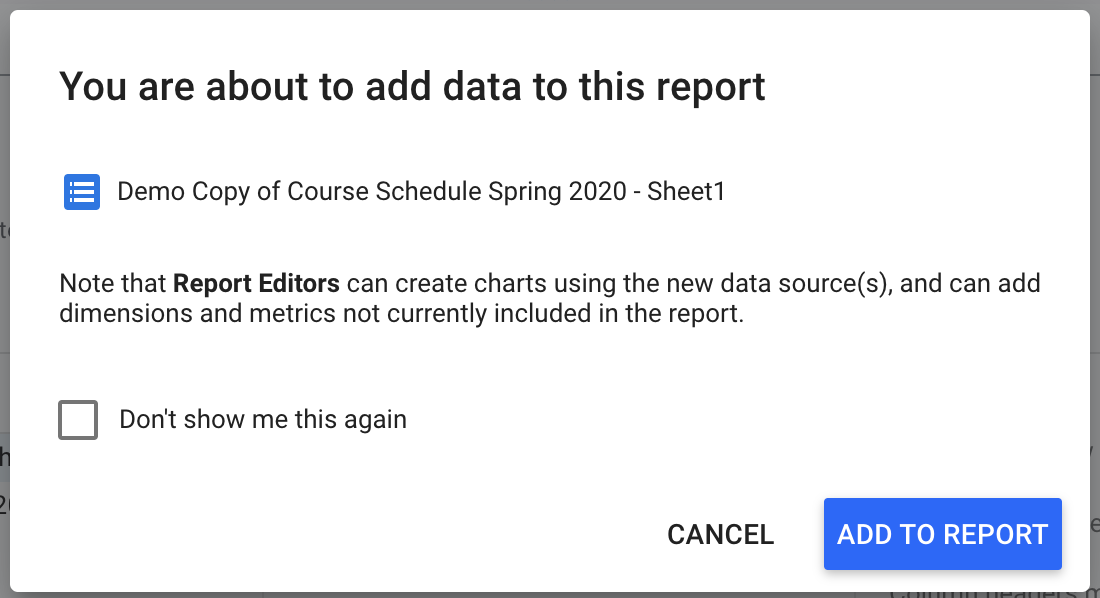
Once you have completed this process, DataStudio will set up a default table view with its best guess as to what type of report you wanted.
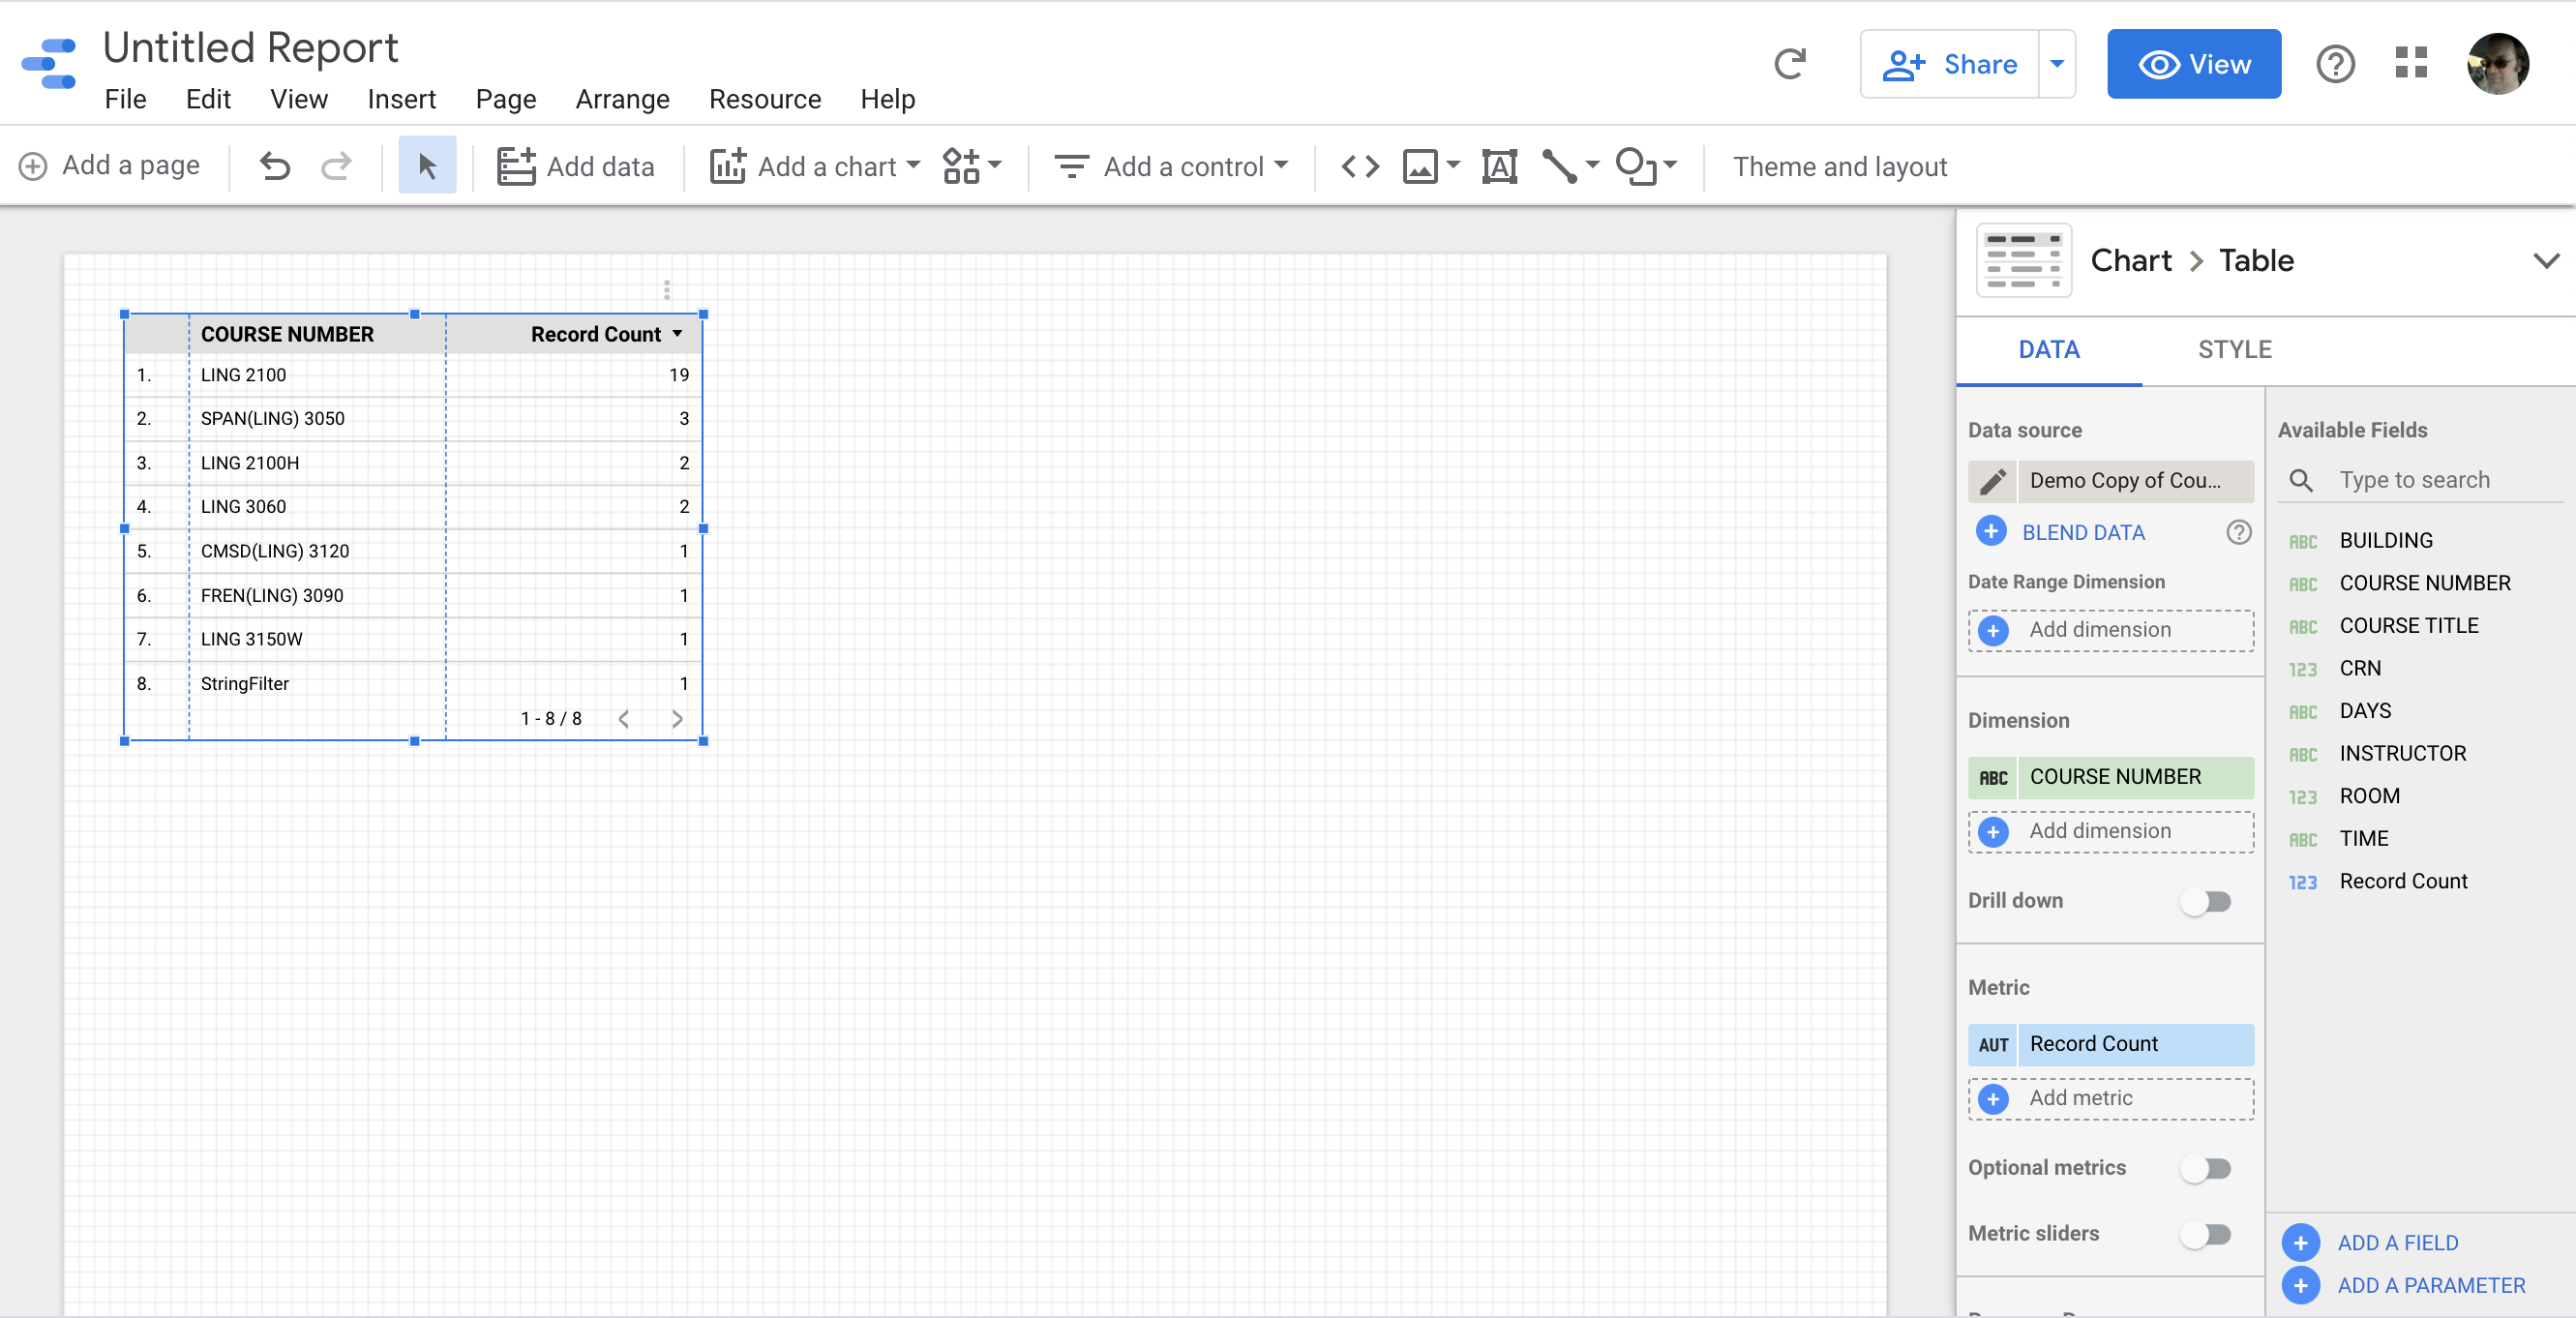
Step 2: Set Up Your Tables in Google DataStudio
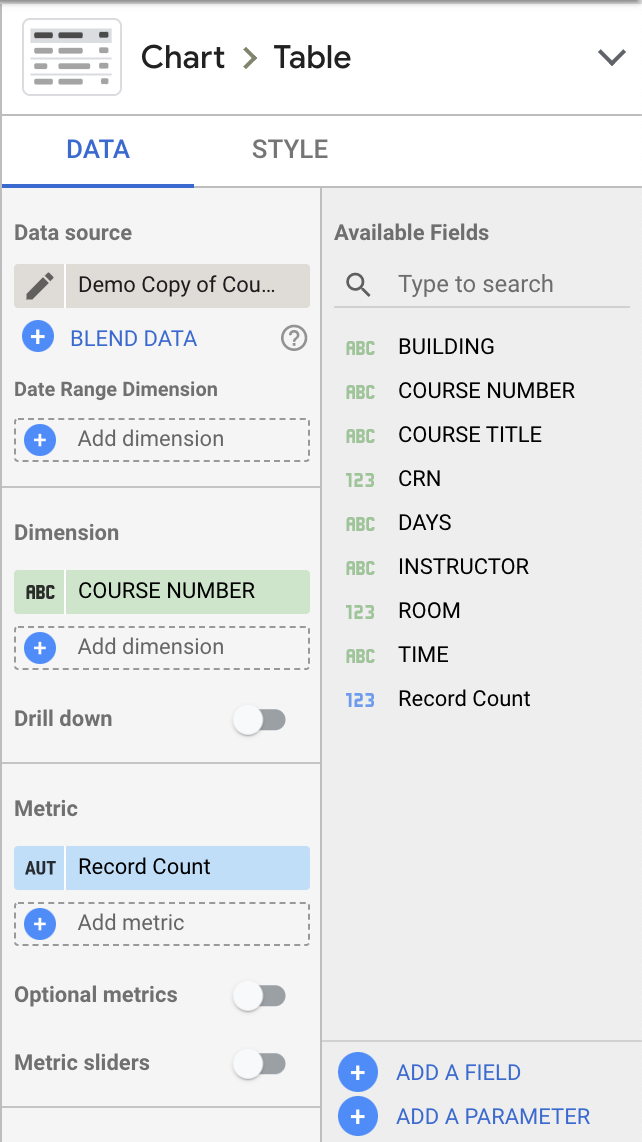
So, the initial guess is missing a lot of what you want. We will focus our attention on the right hand side of the screen:
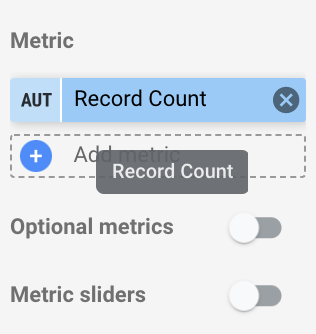
You will want to remove the Record Count entry from the Metric section (so that no metric is listed).

When you hover over that section, an X appears (so that you can delete it). This is a common part of the user interface; you can use it for removing most other dimensions you don't need (if you make a mistake and include them).
You can drag any of the "Available Fields" over to the Dimensions.

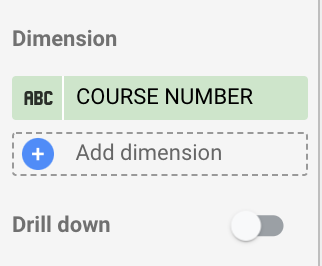
Or, you can click "Add dimension" to add them under the Dimensions heading.
As you add the dimensions, they get added to the table automatically.
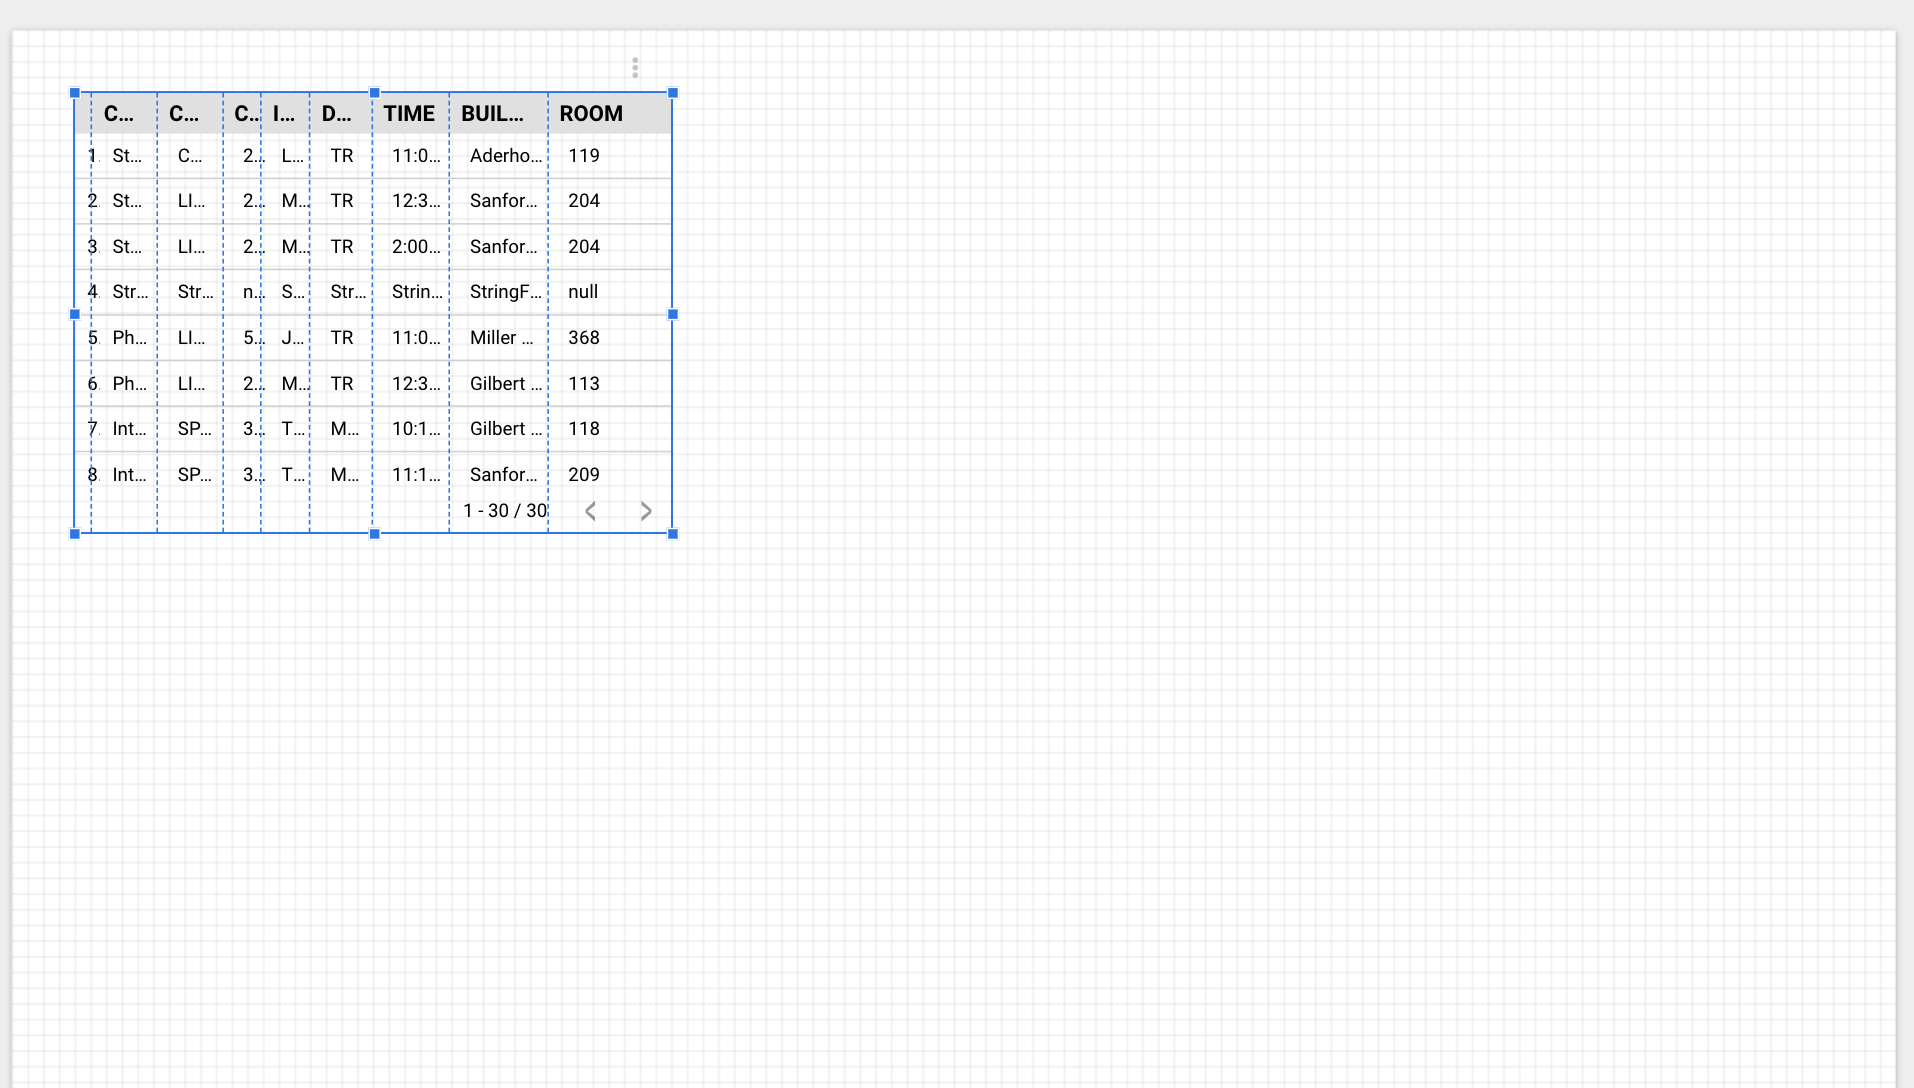
You will want to expand the table to see the entries more clearly.
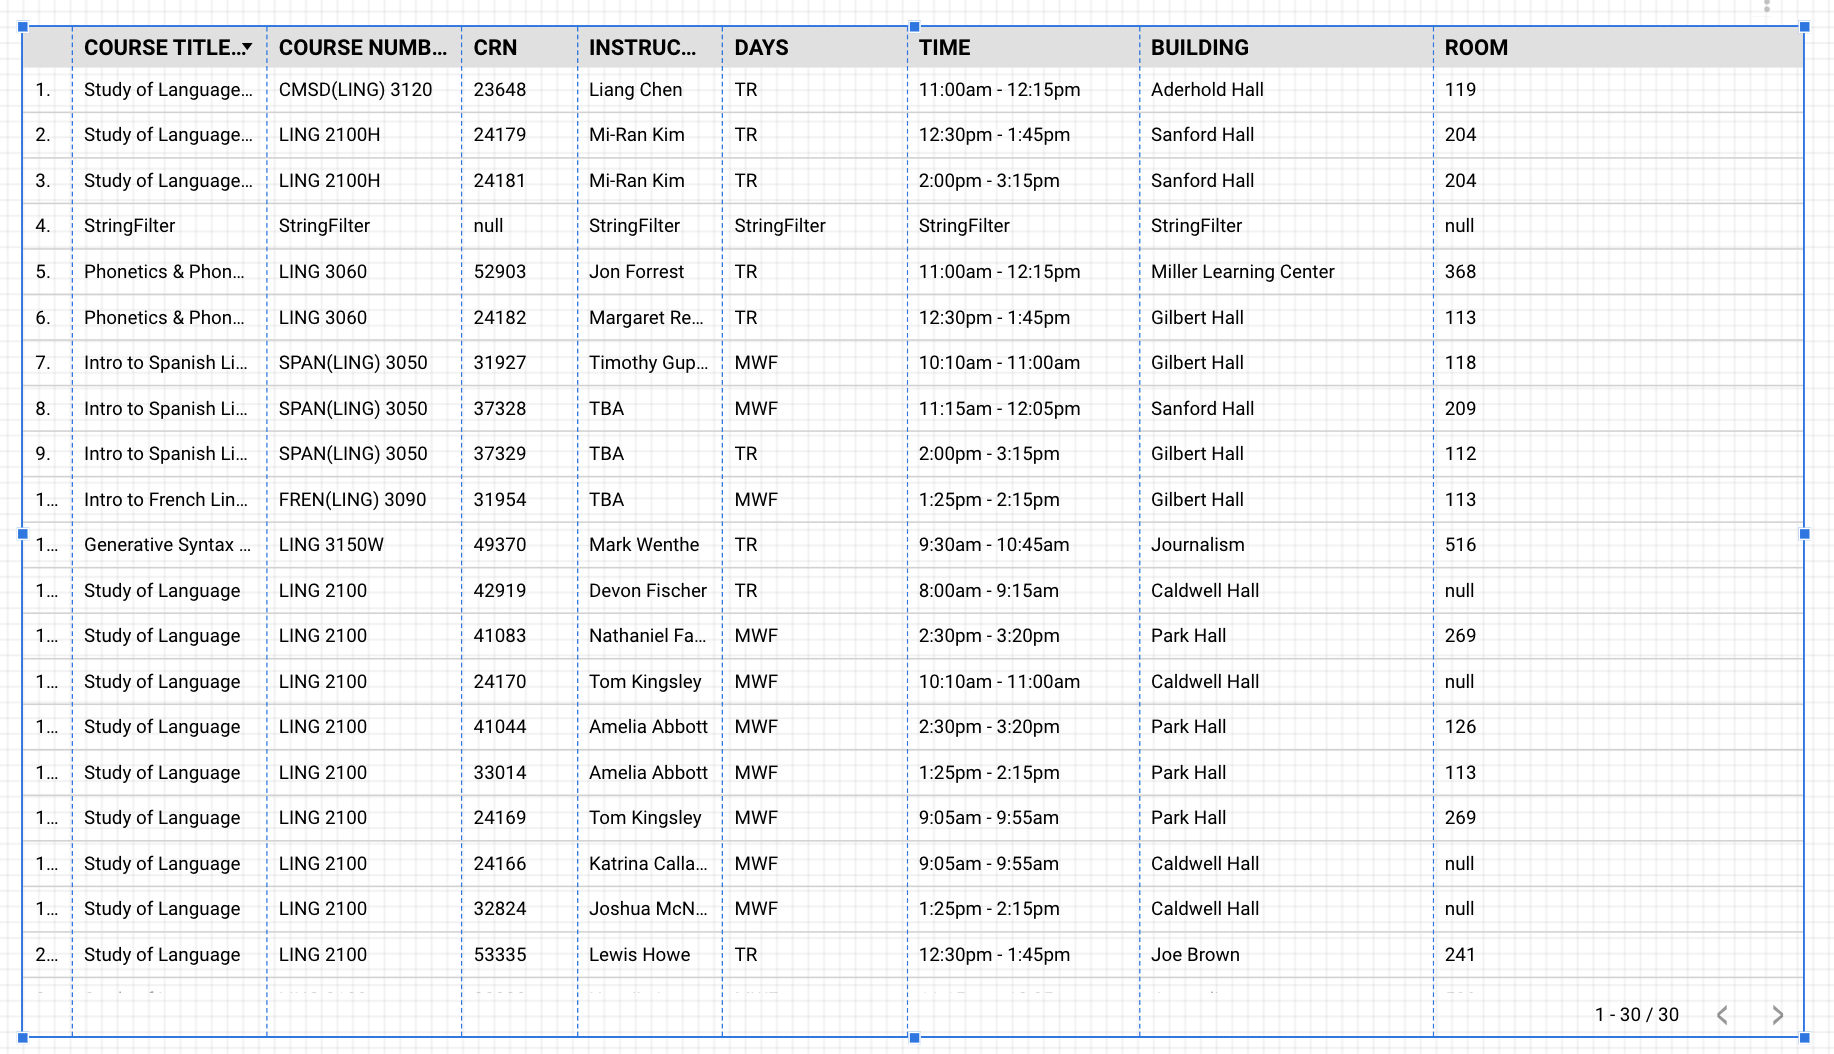
Now, you may notice there's a row number being displayed (that isn't listed under Dimensions). To remove this, you need to go to the Style tab on the right:
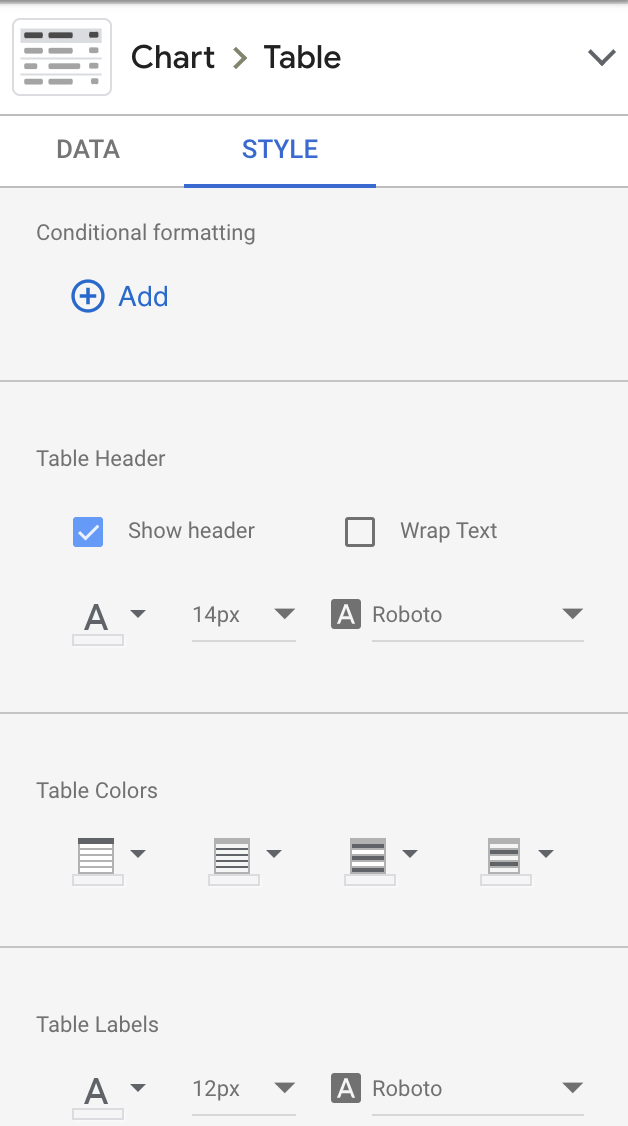
Scroll down a bit, and you will see a checkbox (in "Table Body") for row numbers. Deselect that checkbox.

Much better! (This is also a good time to check and see if you want to reorder the columns, as I do; just drag and drop the items in the Dimension table to reorder.)
Let's put that course number on the left:
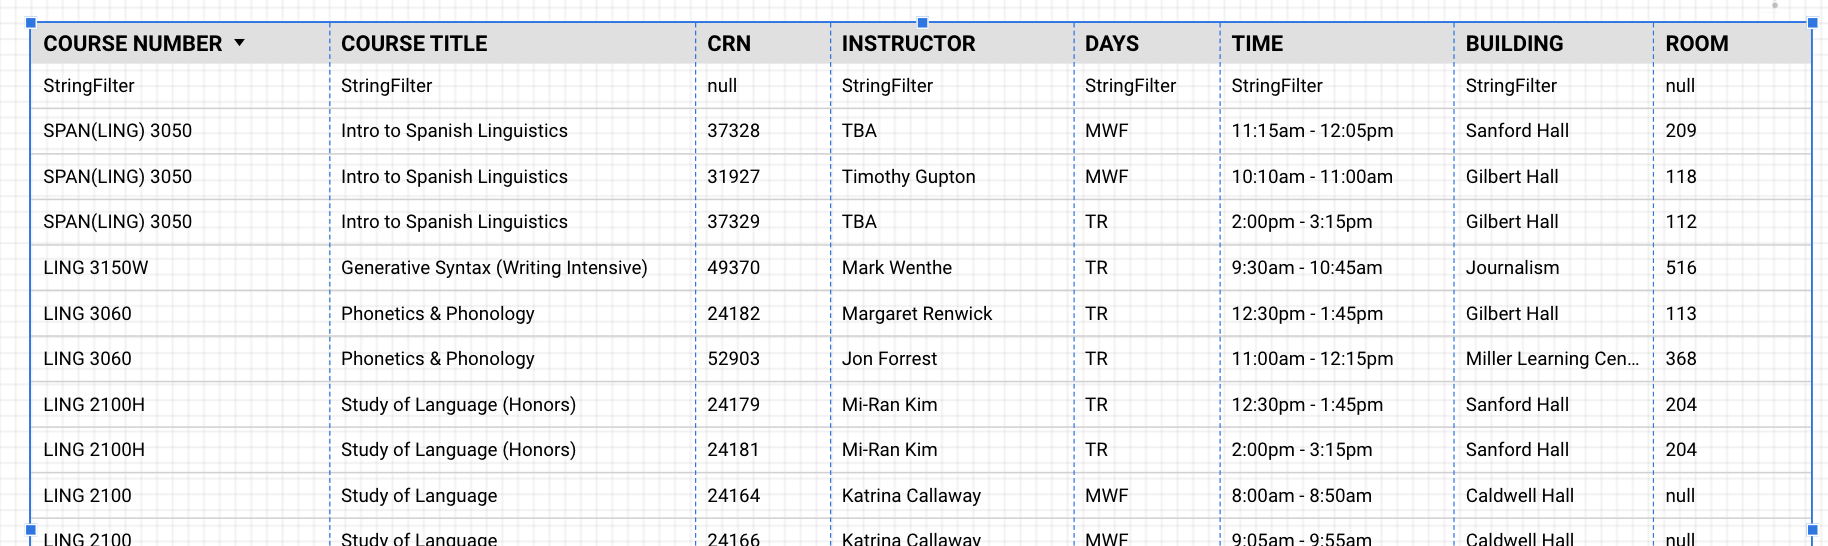
Also, you will probably want to change the default Sort order from this:

to this:

There are other options one can add (including filters and controls), but we will save that for another document. At this point, you should be about ready to embed the report.
Step 3: Set Up Embedding to the Google DataStudio Report
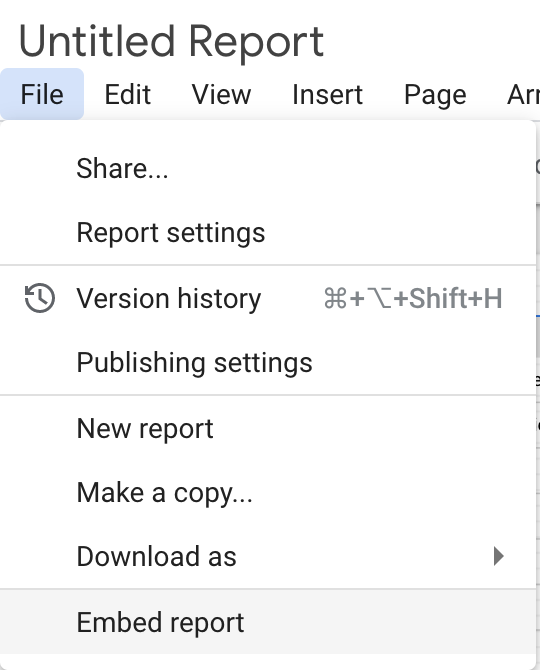
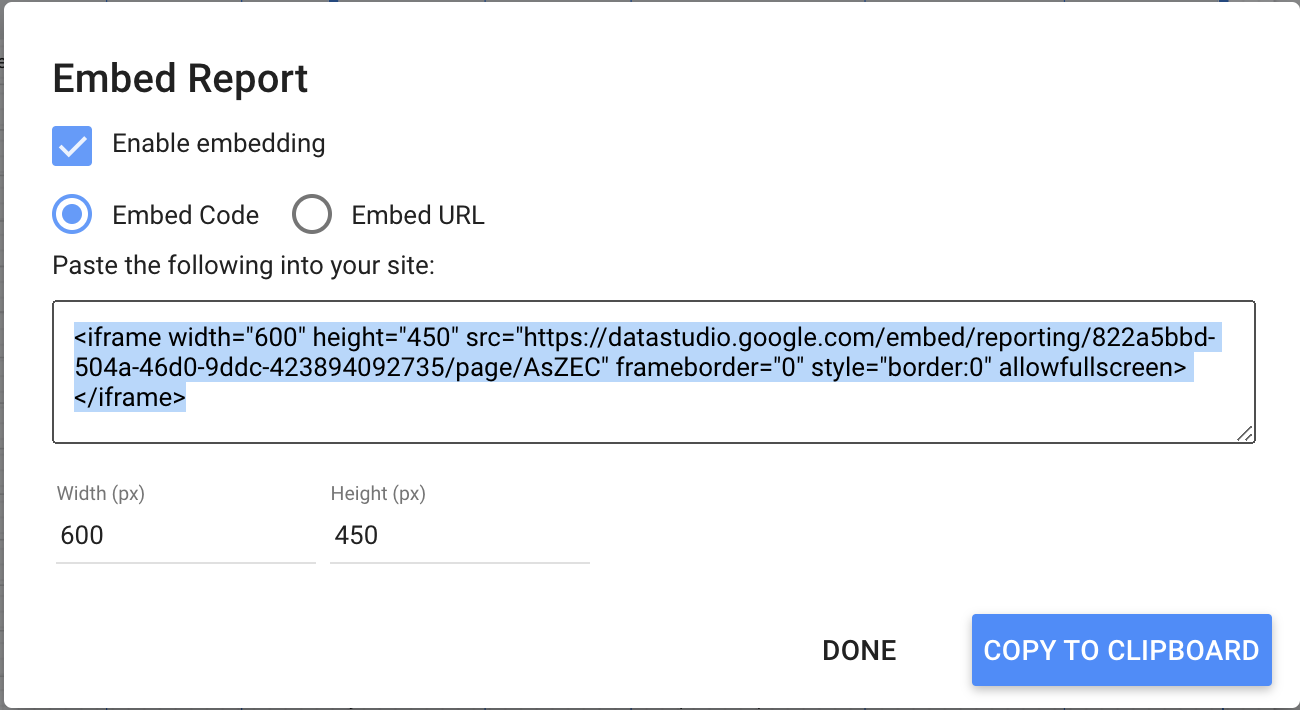
Under the File... menu at the upper left, there's an Embed option, where you can generate either an embed code or an embed URL:
This tutorial assumes you will want an embed code (note the width and height parameters – you may want to change that later on, and this is where you can).
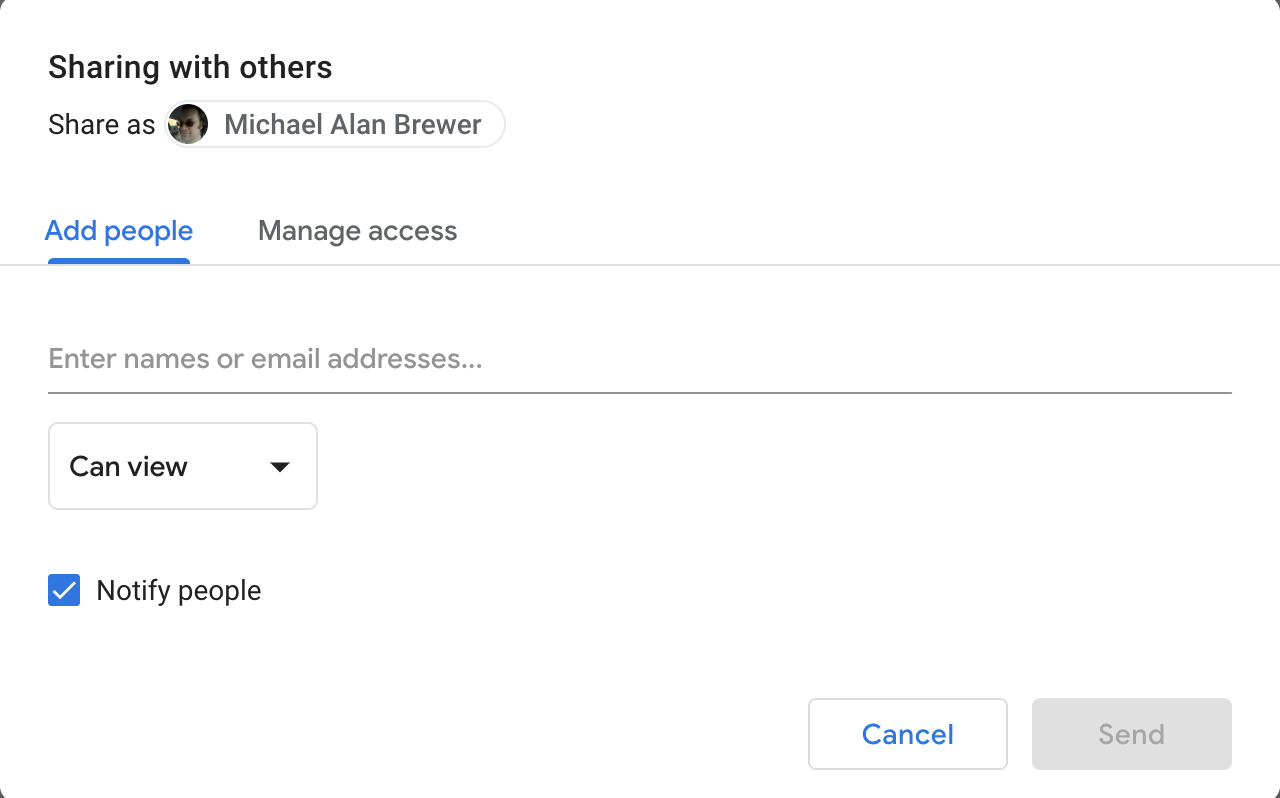
You also should make sure that outsiders can see the report you've created. Go to File...Share...
which will bring up the Sharing with others tab (which can be useful for adding additional editors):
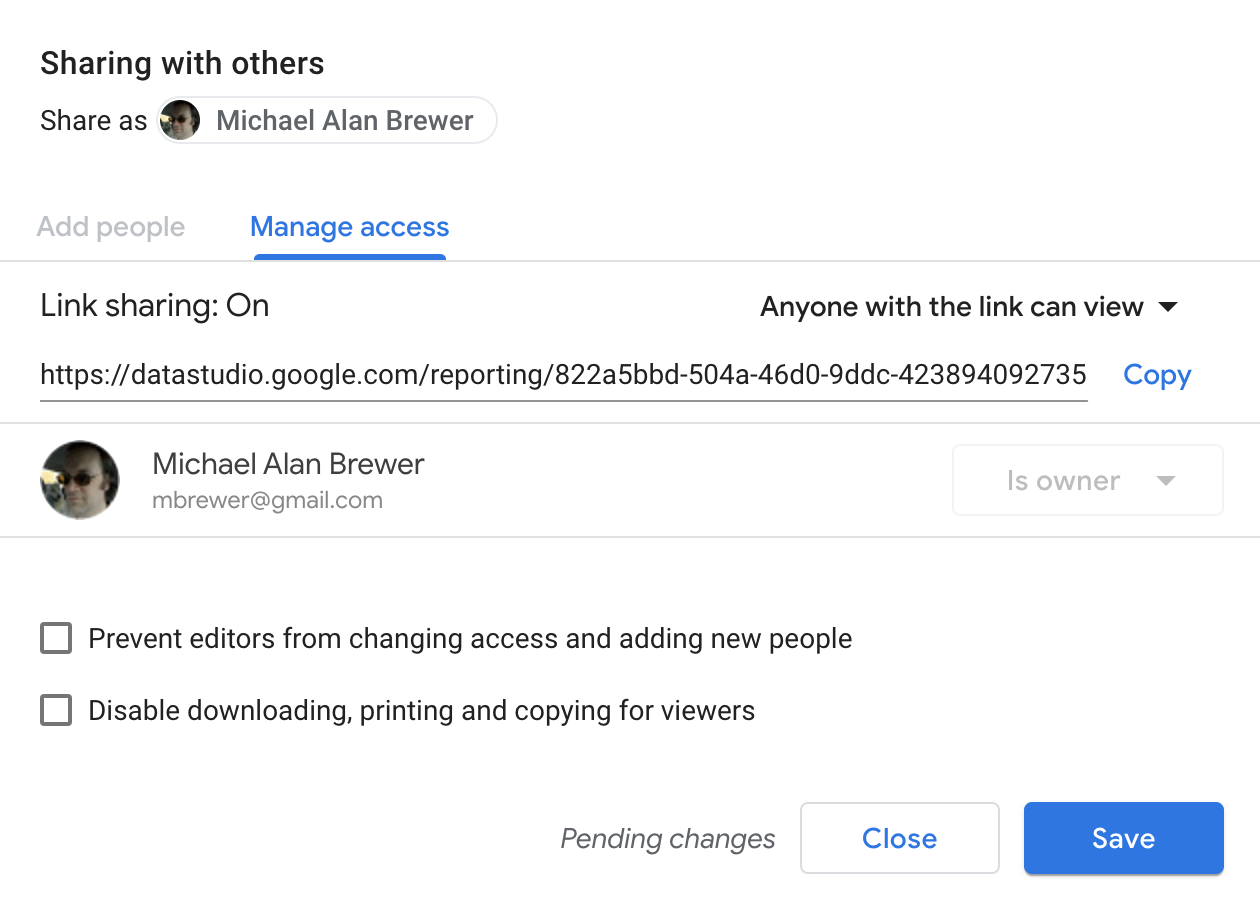
Change to the Manage access tab:

and change the Link Sharing dropdown to "Anyone with the link can view" (NOT edit):
Section 3: Creating a Basic page in Your Drupal Site and Embedding the Report
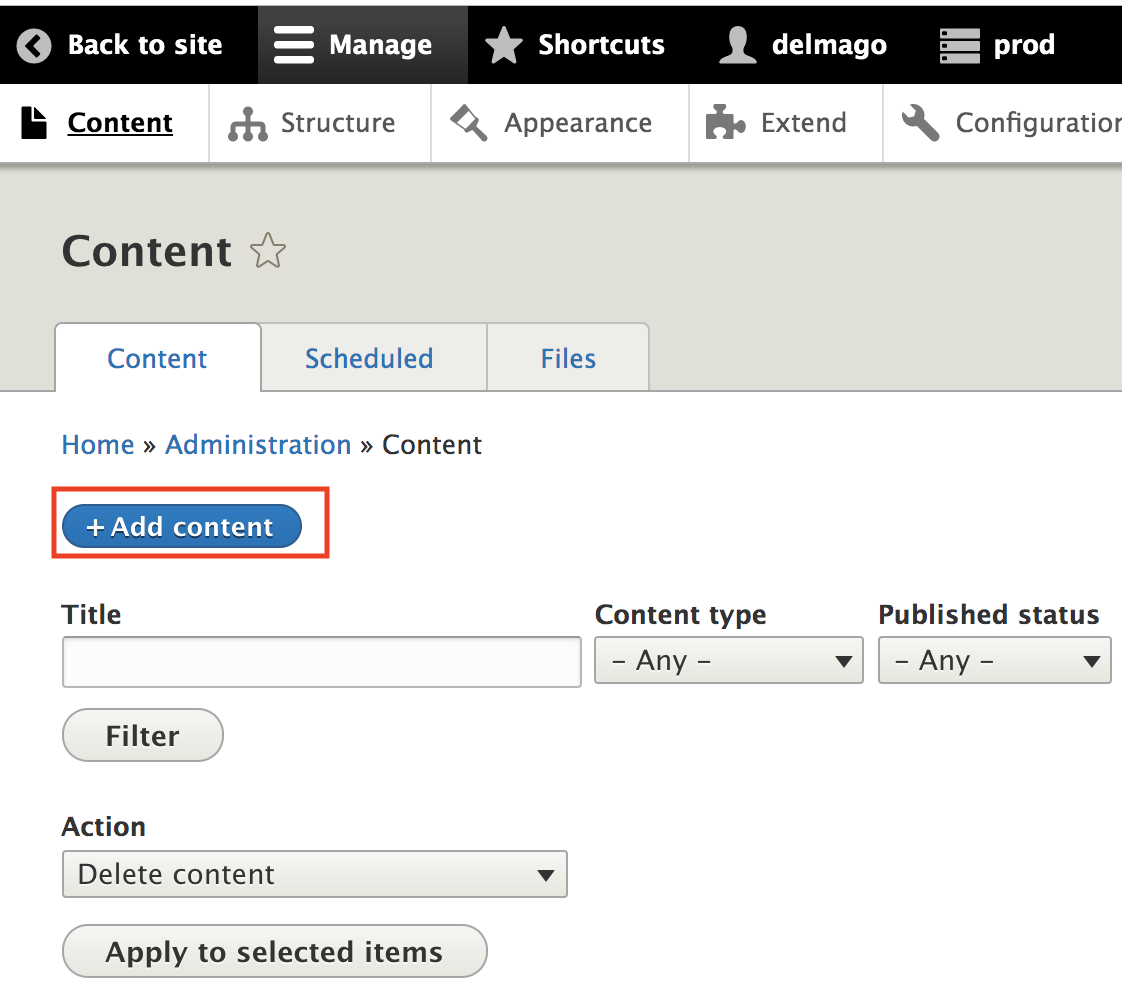
Step 1: Create a Basic Page
In your site, click Add content, then choose "Basic page" as the type of page
Step 2: Embed the Report
In the body of your document, paste the embed code from Google Data Studio (which is always available under File...Embed), along with any other text you need. (You might find it easier to do this in Source view; click the Source button to see and edit directly the HTML.)
Step 3: Save the Page
Save the page and place it in the menu structure, as needed.
To manage any part of your web site, you will have to be logged into the Drupal CMS.
If you need help logging in, please review this login help document.
Monday - Friday 8:00 a.m. - 5:00 p.m. Homepage Directory Service Offerings Franklin OIT Status http://status.franklin.uga.edu/ Receive or Discontinue Status and Service Updates from Franklin OIT UGA/EITS Systems Status Pages https://www.facebook.com/uga.eits USG Systems Status PageContact the Franklin OIT Help Desk
Hours of Operation
Website Information
Systems Status Information
